By Tourism Club | The Story Behind the Industry
Egypt’s hospitality sector entered 2026 with positive momentum, supported by growing international demand, continued hotel investment and the expansion of the country’s tourism infrastructure. However, the real question for hotel owners, General Managers and commercial leaders is not simply whether more tourists are visiting Egypt. The more important question is whether this demand is translating into stronger hotel performance, higher revenue, improved market share and sustainable profitability.
The 2025 baseline: A stronger starting point
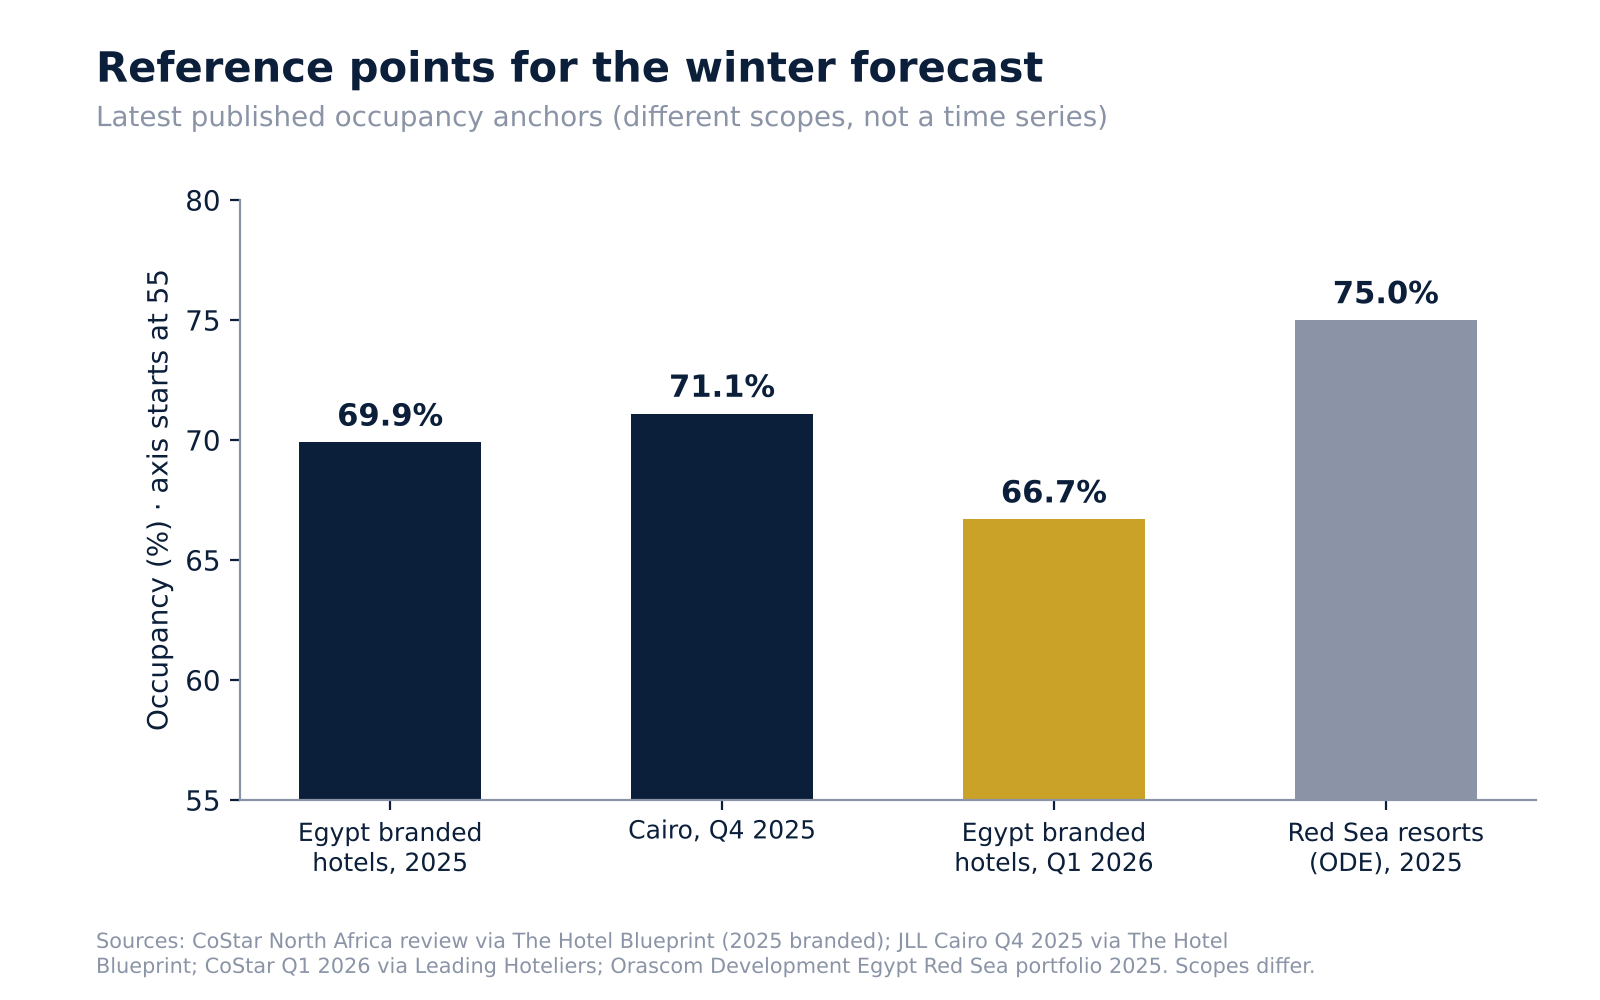
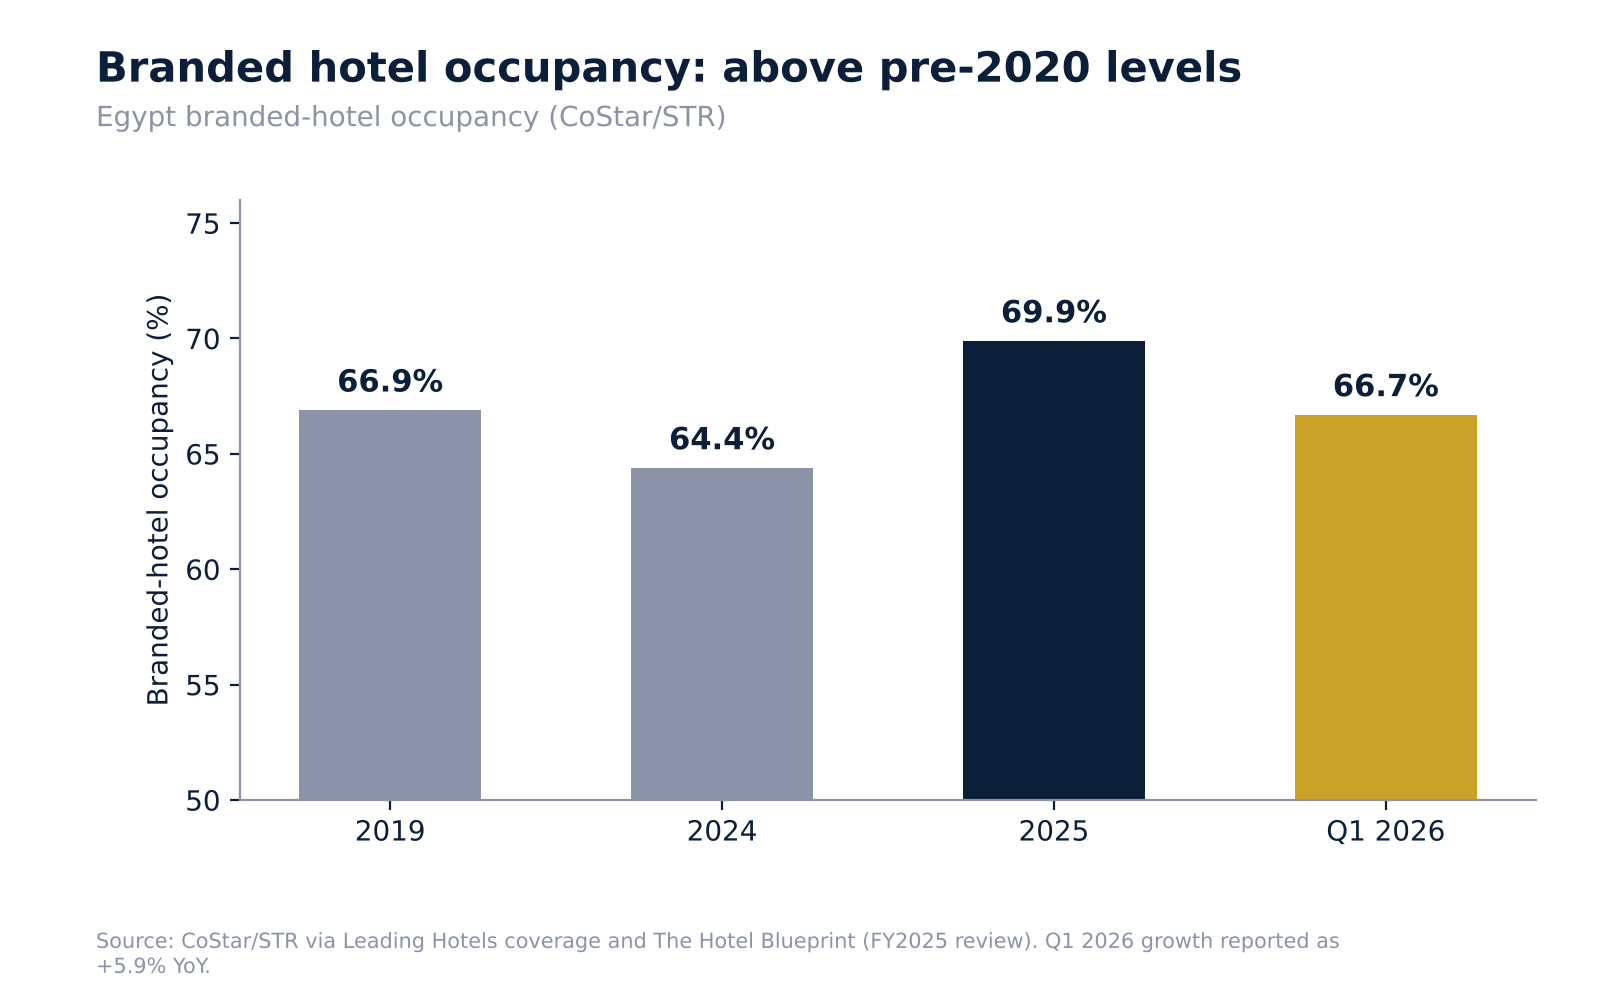
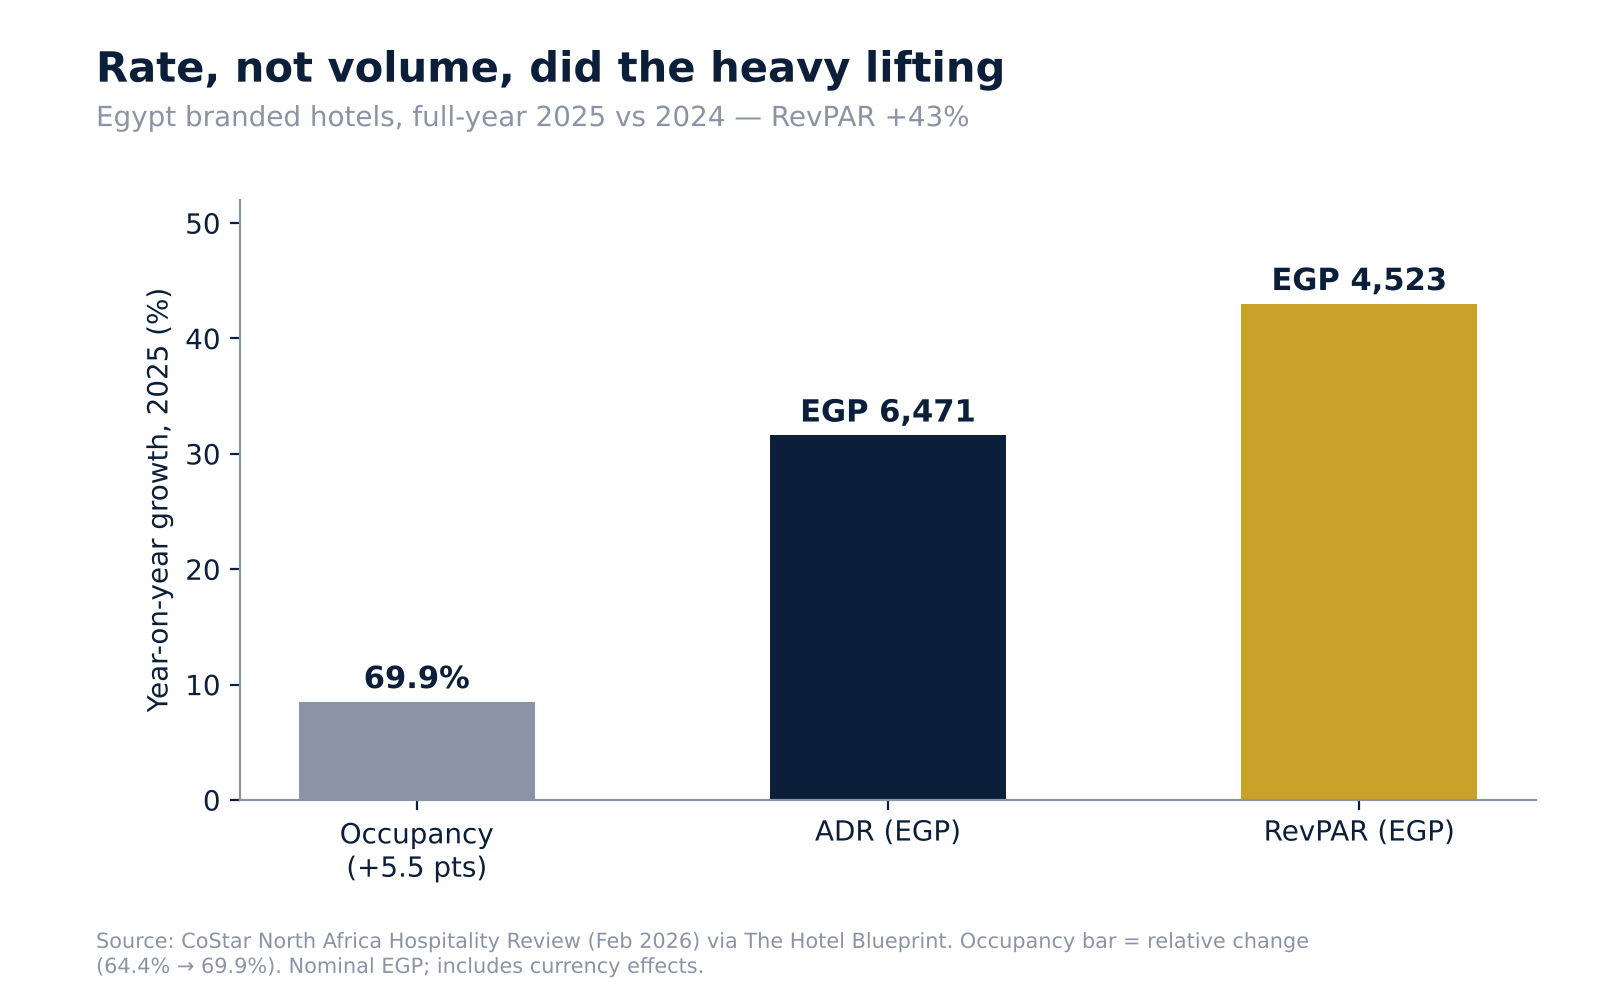
According to CoStar’s reported data for Egypt’s branded hotel market, average Occupancy reached 69.9% in 2025, compared with 64.4% in 2024 and 66.9% in 2019. Average Daily Rate (ADR) reached EGP 6,471, representing an increase of 31.6%, while Revenue per Available Room (RevPAR) increased by 43% to EGP 4,523. These figures indicate that the market achieved more than an improvement in room demand: pricing performance also contributed significantly to revenue growth. However, these figures represent a branded hotel sample, not the entire Egyptian hotel inventory.
Q1 2026: Positive demand momentum
The first quarter continued to demonstrate resilience. Egypt’s branded hotel occupancy reached 66.7%, an increase of 5.9% year-on-year, according to CoStar. Separately, reported tourism data indicated that international arrivals increased by 16% during Q1. These indicators suggest that Egypt remained an attractive destination despite regional uncertainty. Nevertheless, increased arrivals do not automatically translate into equivalent growth in hotel revenue. The conversion depends on destination mix, length of stay, visitor spending, hotel category, distribution channels and the ability of hotels to capture demand at the right rate.
Q2 2026: The importance of destination-level analysis
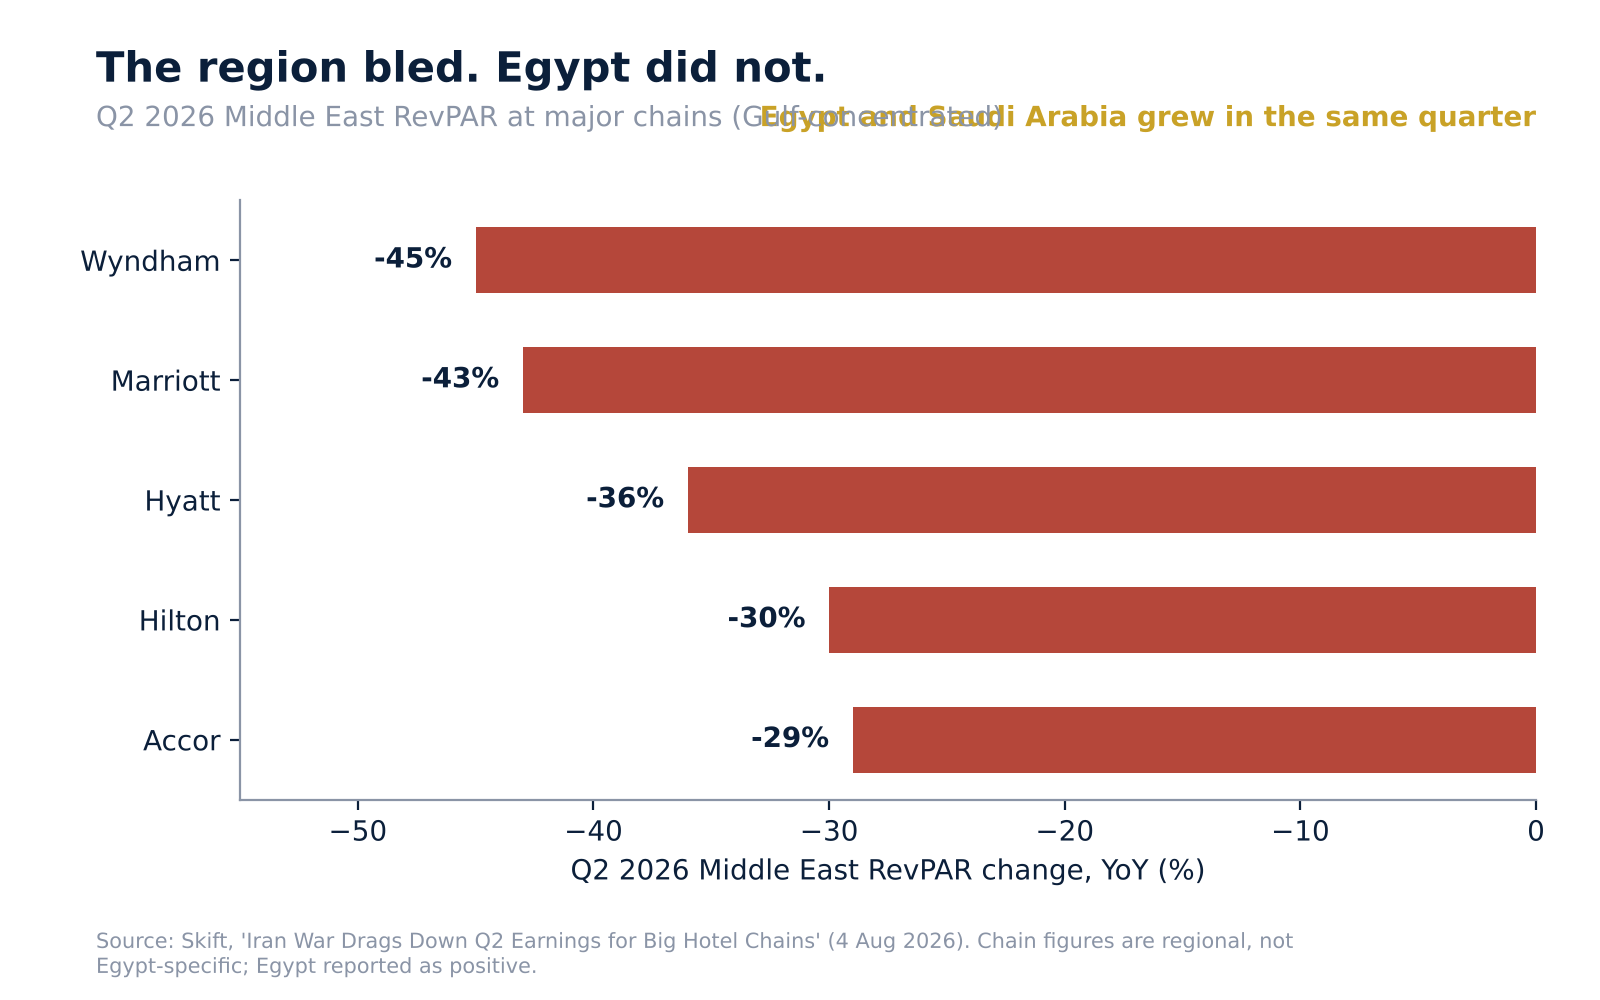
The second quarter highlighted why national tourism figures should not be interpreted as a complete picture of hotel performance. Cairo market coverage reported Occupancy of 62.4% through June, down 3.3 percentage points year-on-year. ADR reached approximately US$154, increasing by 0.6%, while RevPAR declined by 4.6% to around US$96.10. These are Cairo-specific market indicators reported in secondary coverage referencing JLL, not national hotel statistics. They illustrate an important commercial challenge: relatively stable pricing does not necessarily protect RevPAR when Occupancy declines.
Q3 2026: Demand resilience, but the data needs careful interpretation
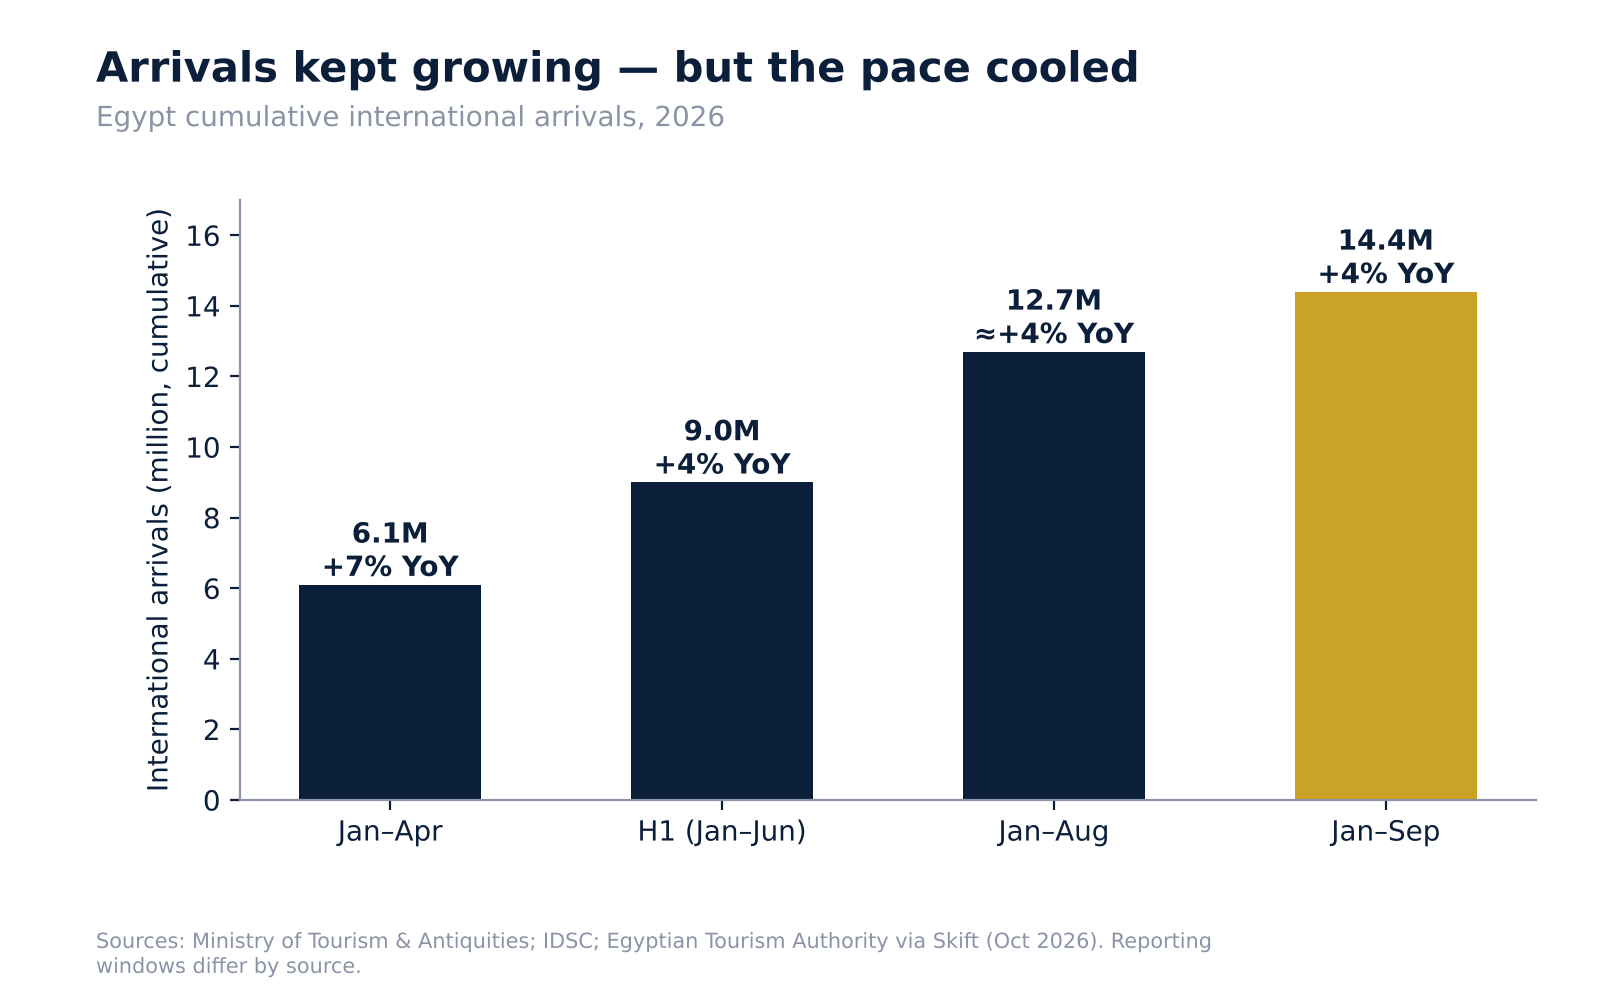
For January to August 2026, official figures reported approximately 12.7 million tourist arrivals, compared with 12.2 million during the same period in the previous year, an increase of around 4.1%. Tourism revenues reached approximately US$12 billion, compared with US$11.8 billion, an increase of around 1.7%. The difference between the growth rates deserves attention. Arrivals increased faster than tourism revenues, suggesting that growth in visitor numbers did not translate into an equivalent increase in total tourism receipts. This is a national tourism indicator, however, and should not be treated as a direct measure of hotel ADR, RevPAR or profitability. It also covers January to August, not the complete third quarter. A complete national Q3 STR dataset has not been established in the public sources reviewed for this article.
Reading hotel performance through STR
For hotel management, three indicators remain central: Occupancy measures the percentage of available rooms sold; ADR measures the average rate achieved for rooms sold; and RevPAR measures room revenue generated per available room. RevPAR is particularly important because it combines Occupancy and ADR. A hotel can increase Occupancy by reducing rates, but this does not necessarily improve RevPAR or profitability. Equally, a hotel can increase ADR while losing market share if its pricing strategy is not aligned with demand and its competitive position.
From performance measurement to competitive positioning
STR benchmarking becomes more valuable when a hotel compares its performance with an appropriate Competitive Set. The Market Penetration Index (MPI) measures Occupancy performance against the competitive set. The Average Rate Index (ARI) measures ADR performance. The Revenue Generation Index (RGI) measures RevPAR performance. An index above 100 indicates performance above the competitive set average, while an index below 100 indicates underperformance. These indicators help management identify whether a hotel is gaining or losing market share, achieving a rate premium, and converting its market position into room revenue. However, the indices must be interpreted together. A high MPI combined with a low ARI may indicate that the hotel is buying Occupancy through lower rates. A high ARI combined with a low MPI may indicate that pricing is limiting demand. A strong RGI indicates that the hotel is outperforming its competitive set in RevPAR, but it does not by itself confirm stronger net profit.
The supply pipeline: Opportunity and competitive pressure
Egypt’s hotel development pipeline is expanding. Government-reported figures indicate a pipeline of approximately 185 hotels and 46,000 rooms in 2026, compared with 143 hotels and 33,900 rooms in 2025, and 109 hotels and 26,200 rooms in 2024. This expansion reflects investor confidence in the destination, but it also raises important strategic questions. Where will this new supply be located? Which segments will it target? Will demand grow at the same pace? And how will existing hotels defend their market share? More rooms create capacity, but capacity alone does not guarantee demand, rate growth or investment returns.
One country, different hotel markets
Egypt should not be treated as one uniform hotel market. Cairo, the Red Sea, the Mediterranean coast, Luxor, Aswan and other destinations have different demand generators, seasonality patterns, customer segments and distribution structures. Cairo’s performance may be influenced by corporate travel, government business, events and MICE activity. Red Sea destinations depend more heavily on leisure demand, international tour operators, airline capacity and seasonal travel patterns. Upper Egypt has a different demand profile, with cultural tourism and Nile cruise activity playing important roles. Consequently, a national Occupancy average cannot replace destination-level analysis. Management decisions should be based on the performance of the specific destination, hotel segment and competitive set.
Revenue growth is not the same as profit growth
One of the most important management considerations is the difference between revenue performance and profitability. Higher ADR and RevPAR are positive indicators, but operating costs may also increase through payroll, energy, food and beverage, maintenance, distribution commissions and other expenses. The final result depends on how effectively the hotel converts revenue into operating profit. This is where Revenue Management must work closely with Sales, Marketing, Finance and Operations. The objective should not be to maximise Occupancy at any cost or increase ADR without considering demand elasticity. It should be to optimise total revenue, manage distribution costs, protect rate integrity and improve profitability.
What should hotel leaders focus on?
For General Managers, Directors of Sales and Marketing, and Revenue Managers, the next phase requires a more disciplined approach to commercial decision-making. First, review STR performance regularly and understand the reasons behind changes in MPI, ARI and RGI. Second, assess the quality of business by segment, source market, channel and booking window rather than focusing only on room nights. Third, strengthen Direct Business while managing the cost and contribution of OTAs and tour operators. Fourth, align pricing decisions with demand forecasts, competitor behaviour and the hotel's positioning. Fifth, connect commercial performance with financial results through indicators such as GOP, GOPPAR and departmental profitability. Finally, build destination-specific strategies instead of relying on national averages.
The strategic question for the coming quarters
The key question is no longer simply how many tourists will visit Egypt. It is how effectively the hospitality industry can convert tourism demand into sustainable economic value. Will the growth in arrivals be accompanied by stronger visitor spending? Will new hotel supply be absorbed without putting pressure on Occupancy and ADR? Can hotels protect their competitive position while controlling operating costs? And will commercial leaders use STR data as a reporting tool or as a foundation for better strategic decisions?
Tourism Club perspective
Egypt’s hospitality opportunity is significant, but growth alone is not a strategy. The next stage of industry development will depend on the quality of investment, the strength of destination management, the competitiveness of hotel products and the ability of leadership teams to make evidence-based decisions. For hotel owners and management teams, the challenge is to move beyond measuring performance to understanding what drives it, why it changes and what action should follow. Because in hospitality, the real competitive advantage is not simply having more rooms or welcoming more guests. It is knowing how to turn demand into value.
Sources and data note: CoStar; JLL, Cairo Hospitality Market Dynamics Q2 2026; Egyptian State Information Service / IDSC; UN Tourism. The figures in this article refer to different datasets, geographic scopes and reporting periods. Branded hotel STR figures, Cairo market indicators and national tourism statistics are not interchangeable. The January–August national tourism figures do not represent a complete Q3 result. No national Q1–Q3 MPI, ARI or RGI values are presented because a complete, verified dataset was not available for this article.